JanWiersma.com

Hivos Expert meeting datacentra

Hivos organiseert een Expert meeting, waar in Datacenter Pulse ook deel zal nemen:

Op vrijdag 28 juni organiseert Hivos een “Expert meeting data centra: Trends in de sector.”

Hivos nodigt u uit om mee te discussieren over prikkelende stellingen en visies van experts uit de sector.

Wilt u zelf een stelling verdedigen of aanvallen? Dan kan ook.

Meer informatie over de bijeenkomst vindt u in de uitnodiging (zie bijlage).

U kunt zich aanmelden door voor 22 juni een bericht te sturen aan expertmeeting@hivos.nl met daarin uw naam en uw bedrijf/organisatie.

De uitnodiging is hier: uitnodiging-def.pdf


Share

DCIM–Its not about the tool; its about the implementation


<English cross post with my DCP blog>

Failure Success Road Sign

So you just finished your extensive purchase process and now the DCIM DVD is on your desk.

Guess what; the real work just started…

The DCIM solution you bought is just a tool, implementing it will require change in your organization. Some of the change will be small; for example no longer having to manually put data in an Excel file but have it automated in the DCIM tool. Some of the change will be bigger like defining and implementing new processes and procedures in the organization. A good implementation will impact the way everyone works in your datacenter organization. The positive outcome of that impact is largely determined by the way you handle the implementation phase.

These are some of the most important parts you should consider during the implementation period:

Implementation team.

The implementation team should consist of at least:

  • A project leader from the DCIM vendor (or partner).
  • An internal project leader.
  • DCIM experts from the DCIM vendor.
  • Internal senior users.

(Some can be combined roles)

Some of the DCIM vendors will offer to guide the implementation process themselves others use third party partners.

During your purchase process its important to have the DCIM vendor explain in detail how they will handle the full implementation process. Who will be responsible for what part? What do they expect from your organization? How much time do they expect from your team? Do they have any reference projects (same size & complexity?)?

The DCIM vendor (or its implementation partner) will make implementation decisions during the project that will influence the way you work. These decisions will give you either great ease of working with the tool or day-to-day frustration. Its important that they understand your business and way of working. Not having any datacenter experience at all will not benefit your implementation process, so make sure they supply you with people that know datacenter basics and understand your (technical) language.

The internal senior users should be people that understand the basic datacenter parts (from a technical perspective) and really know the current internal processes. Ideal candidates are senior technicians, your quality manager, backoffice sales people (if you’re a co-lo) and site/operations managers.

The internal senior users also play an important role in the internal change process. They should be enthusiast early adapters who really want to lead the change and believe in the solution.

Training.

After you kicked off your implementation team, you should schedule training for your senior users and early adaptors first. Have them trained by the DCIM vendor. This can be done on dummy (fictive) data. This way your senior users can start thinking about the way the DCIM software should be used within your own organization. Include some Q&A and ‘play’ time at the end of the training. Having a sandbox installation of the DCIM software available for your senior users after the training also helps them to get more familiar with the tool and test some of their process ideas.

After you have done the loading of your actual data and you made your process decisions surrounding the DCIM tool, you can start training all your users.

Some of the DCIM vendors will tell you that training is not needed because their tool is so very user friendly. The software maybe user friendly but your users should still need to be trained on the specific usage of the tool within your own organization.

Have the DCIM vendor trainer team up with your senior users in the actual training. This way you can make the training specific for your implementation and have the senior users at hand to answer any organization specific questions.

The training of general users is an important part of the change and process implementation in your organization.

Take any feedback during the general training seriously. Provide the users with a sandbox installation of the software so they can try things without breaking your production installation and data. This will give you broad support for the new way of working.

Data import and migration.

Based on the advise in the first article , you will already have identified your current data sources.

During the implementation process the current data will need to be imported in to the DCIM data structure or integrated.

Before you import you will need to assess your data; are all the Excel, Visio and AutoCAD drawings accurate? Garbage import means garbage output in the DCIM tool.

Intelligent import procedures can help to clean your current data; connecting data sources and cross referencing them will show you the mismatches. For example: adding (DCIM) intelligence to importing multiple Excel sheets with fiber cables and then generating a report with fiber ports that have more than 1 cable connected to them (which would be impossible i.r.l ).

Your DCIM vendor or its partner should be able to facilitate the import. Make sure you cover this in the procurement negotiations; what kind of data formats can they import? Should you supply the data in a specific format?

This also brings us back to the basic datacenter knowledge of the DCIM vendor/partner. I have seen people import Excel lists of fiber cable and connect them to PDU’s… The DCIM vendor/partner should provide you a worry free import experience.

Create phases in the data import and have your (already trained) senior users preform acceptance tests. They know your datacenter layout and can check for inconsistencies.

Prepare to be flexible during the import; not everything can be modeled the way you want it in the software.

For example when I bought my first DCIM tool in 2006 they couldn’t model blade servers yet and we needed a work around for it. Make sure the workarounds are known and supported by the DCIM vendor; you don’t want to create all your workaround assets again when the software update finally arrives that supports the correct models. The DCIM vendor should be able to migrate this for you.

Integration.

The first article did a drill down of the importance of integration. Make sure your DCIM vendor can accommodate your integration wishes.

Integration can be very complex and mess-up your data (or worse) if not done correctly. Test extensively, on non-production data, before you go live with integration connections.

The integration part of the implementation process is very suitable for a phased approach. You don’t need all the integrations on day one of the implementation.

Involve IT Information architects if you have them within your company and make sure external vendors of the affected systems are connected to the project.

Roadmap and influence.

Ask for a software development roadmap and make sure your wishes are included before you buy. The roadmap should show you when new features will be available in the next major release of you
r DCIM tool.

The DCIM vendor should also provide you with a release cycle displaying the scheduled minor releases with bug fixes. When you receive a new release it should include release-notes mentioning the specific bugs that are fixed and the new features included in that new release. Ask the DCIM vendor for an example of the roadmap and release-notes.

During the purchase process you may have certain feature requests that the vendor is not able to fulfill yet. Especially new technology, like the blade server example I used earlier, will take some time to appear in the DCIM software release. This is not a big problem as long as the DCIM vendor is able to model it within reasonable time.

One way to handle missing features is to make sure it’s on the software development roadmap and make the delivery schedule part of your purchase agreement.

After you signed the purchase order your influence on the roadmap will become smaller. They will tell you it doesn’t… but it does… Urge your DCIM vendor to start a user-group. This group should be fully facilitated by the vendor and provide valuable input for the roadmap and the future of the DCIM tool. A strong user-group can be of great value to the DCIM vendor AND its customers.

Got any questions on real world DCIM ? Please post them on the Datacenter Pulse network: http://www.linkedin.com/groups?gid=841187 (members only)

Share

Before you jump in to the DCIM hype…

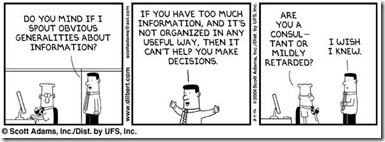
dilbert-information-strategy

<English cross post with my DCP blog>

You’re ready to enter the great world of DCIM software and jump right into the hype ?

Do you actually know what you need from a DCIM solution ? What are your functional requirements ?

So before you jump in, let’s take a step back and look at DataCenter Information Management from a 40,000 feet level: the datacenter facility information architecture.

Let’s start with ‘data’;

Data is all around us in the datacenter environment. It’s on the post-it notes on your desk, the dozen Excel files you manage to report and collect measurements and the collection of electrical and architectural drawings sitting in your desk drawer.

A modern day datacenter is filled with sensors connected to control systems. Some of the equipment is connected to central SCADA or BMS systems, some handle all the process control locally at the equipment. HVAC, electrical distribution and conversion systems, access control and CCTV; they all generate data streams. With the growth of datacenters in square meters and megawatts, the amount of data grows too.

The introduction of PUE and focus on energy efficiency have shown us the importance of data and especially data analysis. For most of us this has introduced even more data points, but enabled us to do better analysis of our datacenter’s performance. So; more data has enabled more efficiency and a better return on investment. Some of us could even say they entered the BigData era with datacenter facility data.

DCIM can play a role in the analysis of all this data, but it’s important to know where your data is first. Where is the current data stored ? What are the data streams within your datacenter ? What data is actually available and what data actually matters to your operation ? It’s a false assumption that all the data needs to be pulled in to a DCIM solution; that depends on your processes and your information requirements.

Process

Every datacenter has its collection of structured activities or tasks that produce a specific service or product for our internal or external customer. These are the primary processes focusing on the services your datacenter needs to provide. Examples are operations processes like Work Orders or Capacity Management.

These primary processes are assisted by supporting processes that make the core (primary) processes work and optimize them. Examples are Quality, Accounting or Recruitment processes.

Indentifying the primary and supporting processes in your datacenter enables you to optimize them by executing them in a consisted way very time and checking the output.

If you run an ISO9001 certified shop, you will definitely know what I’m talking about.

To run the processes we need information. Information is used in our processes to make decisions. The needed information can be collected and supplied by an individual or an (IT) system.

When data is collected it’s not yet information. Applying knowledge creates information from data. IT systems can assist us to create information from data, with built-in or collected knowledge.

Indentifying your datacenter processes also enables you to get a grip on the information that is needed to move the processes forward. Is this information available ? What is the quality of the information and process output ? How much time does it take to make it available ? Can this be optimized ?

DCIM solutions can assist you in creating information from data and provide information and process optimization. Most of the DCIM solutions depend on built-in knowledge on how datacenters work and operate, to facilitate this and optimize processes.

DCIM is only one of the applications used to support and optimize our datacenter processes. To support the full stack of processes we need a whole range of applications and tools. These applications can be everything from Planning to Asset Management to Customer Relationship Management (CRM) to SCADA/BMS tools.

Most of us already have some type of SCADA or BMS system running in our datacenter to control and monitor our facility infrastructure. This SCADA or BMS system will handle typical facility protocols like Modbus, BACnet or LonWorks. The programming logic used in most SCADA/BMS systems is not something found in typical DCIM solutions.

With the growing amount of sensors and their data, the SCADA/BMS system must be able to handle hundreds of measurements per minute. It must store, analyze and be able to react-on the provided data to control things like remote valves and pumps. This functionality is also typically not found in DCIM solutions. (So SCADA/BMS does not equal (!=) DCIM.)

Anyone running a production datacenter will already have a collection of applications to support their datacenter processes. You may have a ticketing system, a CRM application, MS Office application, etc.. Some times DCIM is perceived as the only tool you need to manage your datacenter but it will definitely not replace all your current tools and applications.

Model

Now that you have indentified your data, processes and current applications it’s time to focus on what you need DCIM for anyway; define your functional requirements.

One way of assisting you in this definition is creating your own datacenter facility information model.

IT architects are trained in creating information models, so if you have any walking around ask them to assist you.

Example of a model would be the one that the 451 Group created for their DCIM analysis. This is featured in the DCK Guide to Data Center Infrastructure Management (DCIM) (The model doesn’t cover the full scope for every organization, but it helps me to explain what I mean in this blog…)
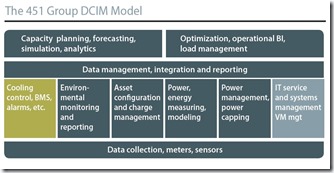
dcim-451group

The model displays functionality fields what would typically exist when operating a datacenter.

You can use a model like this to identify what functionality you currently don’t have (from a process and application perspective) and what can be optimized.

It also enables you to plot your current tools on the model and indentify gaps and overlap. In this example I have plotted one of my SCADA/BMS systems on the (slightly modified) model:
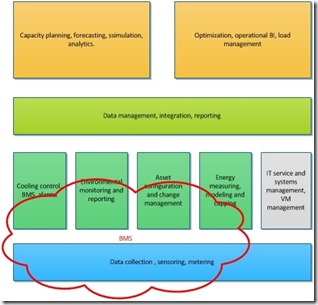
dcim-plot-bms

I have also plotted the DCIM need for that project:
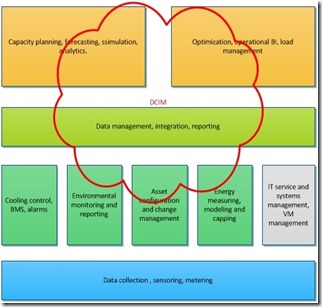
dcim-plot-dcim

Using models like this will give you a sense of what you actually expect from a DCIM solution and assist in creating your functional requirements for DCIM tool selection (RFP/RFI).

Integration is key

Modern day IT information management consists of collections of applications and datastores, connected for optimal information exchange. IT information and business architects have already tried the ‘one application to rule them all’ approach before and failed. Because creating information islands also doesn’t work, we need to enable applications and information stores to talk to each other.

You may have some customer information about the usage of datacenter racks in a CRM system like Salesforce. You may already have some asset information of your CRAC’s in a asset management system or maybe an procurement system. This is all interesting and relevant information for your ‘datacenter view on the world’. Connecting all the systems and datastores could get really ugly, time consuming and error-prone:
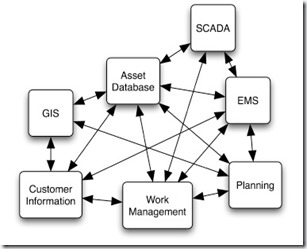
dc-info-connect

IT architects have already struggled with this some time ago when integrating general business applications. This has started things like Service-oriented architecture (SOA) , enterprise service bus (ESB) and application programming interface (API). All fancy words (and IT loves their 3 letter acronyms) for IT architectural models, to be enable applications to talk to each other.
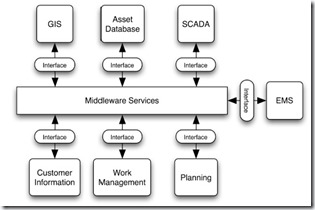
dc-info-connect-soa

The DCIM solution you select, needs to be able to integrate in to your current world of IT applications and datastores.

When looking at integration, you need to decide what information is authoritative and how the information will flow. Example: you may have an asset management system containing unique asset names and numbers for your large datacenter assets like pumps, CRACs and PDUs. You would want this information to be pushed out to the DCIM solution but changes in the asset names should only be possible in the asset management system. Your asset management system would then be considered authoritative for those information fields and information will only be pushed from the asset system to DCIM and not vice versa (flow).

Integration also means you don’t have to pull all the data from every available data source in to your DCIM solution. Select only the information and data that would really add value to your DCIM usage. Also be aware that integration is not the only way to aggregate data. Reporting tools (sometimes part of the DCIM solution) can collect data from multiple datasources and combine them in one nice report, without the need to duplicate information by pulling a copy in to the DCIM database.

The 451group model does an excellent job of displaying this need for integration showing the “integration and reporting” layer across all layers.

Using your own information model you can also plot integration and data sources.
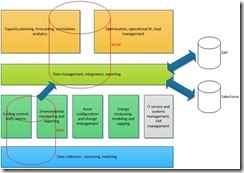
dcim-plot-integrate

Integration within the full datacenter stack (from facilities to IT)  is also key for the future of datacenter efficiency like I mentioned in my “Where is the open datacenter facility API ?” blog.

So, to summarize:

  • Look at what data you currently have, where it is stored and how that data flows across your infrastructure.
  • Look at the information and functionality you need by analyzing your datacenter processes. Indentify information gaps and translate them to functional requirements.
  • Look at the current tools and applications ; what applications to replace with DCIM and what applications to integrate with DCIM. What are the integration requirements and what information source is authoritative ?
  • Create your own datacenter facility information model. Position all your current applications on the model. (If you have in-house IT (information) architects; have them assist you…)

Preparing your DCIM tool selection this way will save you from headaches and disappointment after the implementation.

In my next blog we will jump to the implementation phase of DCIM.


More resources:

Full credits for the DCIM model used in this blog, go to the 451Group. Taken from the excellent DCK Guide to Data Center Infrastructure Management (DCIM) at http://www.datacenterknowledge.com/archives/2012/05/22/guide-data-center-infrastructure-management-dcim/

Disclosure: between 2006 and 2012 I have selected, bought and implemented three different DCIM solutions for the companies I worked for. At that time I was also part of either the beta-pilot group for those vendors or on the Customer Advisory Board. That doesn’t make me a DCIM expert, but it generated some insight into what is sold and what actually works and gets used.

Share

Radio 1 besteed aandacht aan energie&datacentra

Het is geen geheim dat er (overheids) aandacht is voor de hoeveelheid energie die datacentra verbruiken. Er zijn echter ook een hoop initiatieven om dit energie verbruik in te dammen. Hierbij word dan met name gekeken naar de ‘overhead’ energie; de energie die niet naar IT gaat, maar verbruikt word voor bijvoorbeeld koeling.

De gemeente Amsterdam is een grote aanjager van deze efficiëntie slag. Sinds 2011 ligt er al een ‘Green deal’ tussen de rijksoverheid en de gemeente voor deze aanjagers rol.

In deze Green Deal staat zelfs:

Op basis van de Amsterdamse acties streeft de stad naar het vastleggen van een landelijke prestatienorm op basis van best beschikbare technieken voor nieuwe installaties op basis van best beschikbare technieken voor bestaande datacenters op best haalbare prestatie

De Amsterdamse Groenlinks wethouder Maarten van de Poelgeest zit hier boven op, want zo schrijft hij in zijn blog:

Wel is het zo dat de 36 Amsterdamse datacentra maar liefst 11% van het Amsterdamse bedrijfsverbruik voor haar rekening nemen.

Het Radio 1 programma Vara Vroege Vogels ging daarom bij de wethouder op bezoek en besprak de mogelijkheden voor energie efficiënte koeling met Jan Wiersma. Het fragment is te vinden op de site van de Vara: Datacenters:groener! en een copy hier (mp3) lokaal.

Share

Where is the open datacenter facility API ?

<English cross post with my DCP blog>

For some time the Datacenter Pulse top 10 has featured an item called ‘ Converged Infrastructure Intelligence‘. The 2012 presentation mentioned:stack21-forceX

Treat the DC infrastructure as an IT system;
– Converge in the infrastructure instrumentation and control systems
– Connect it into the IT systems for ultimate control
Standardize connections and protocols to connect components

With datacenter infrastructure becoming a more complex system and the need for better efficiency within the whole datacenter stack, the need arises to integrate layers of the stack and make them ‘talk’ to each other.

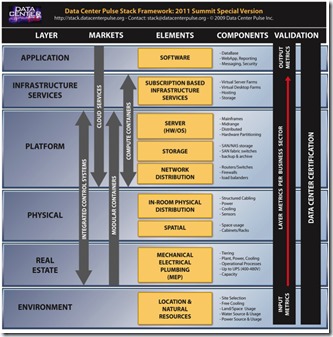
This is shown in the DCP Stack framework with the need for ‘integrated control systems’; going up from the (facility) real-estate layer to the (IT) platform layer.

So if we have the ‘integrated control systems’, what would we be able to do?

We could:

  • Influence behavior (can’t control what you don’t know); application developers can be given insight on their power usage when they write code for example. This is one of the needed steps for more energy efficient application programming. It will also provide more insight of the complete energy flow and more detailed measurements.
  • Design for lower level TIER datacenters; when failure is imminent, IT systems can be triggered to move workloads to other datacenter locations. This can be triggered by signals from the facility equipment to the IT systems.
  • Design close control cooling systems that trigger on real CPU and memory temperature and not on room level temperature sensors. This could eliminate hot spots and focus the cooling energy consumption on the spots where it is really needed. It could even make the cooling system aware of oncoming throttle up from IT systems.
  • Optimize datacenters for smart grid. The increase of sustainable power sources like wind and solar energy, increases the need for more flexibility in energy consumption. Some may think this is only the case when you introduce onsite sustainable power generation, but the energy market will be affected by the general availability of sustainable power sources also. In the end the ability to be flexible will lead to lower energy prices. Real supply and demand management in the datacenters requires integrated information and control from the facility layers and IT layers of the stack.

Gap between IT and facility does not only exists between IT and facility staff but also between their information systems. Closing the gap between people and systems will make the datacenter more efficient, more reliable and opens up a whole new world of possibilities.

This all leads to something that has been on my wish list for a long, long time: the datacenter facility API (Application programming interface)

I’m aware that we have BMS systems supporting open protocols like BACnet, LonWorks and Modbus, and that is great. But they are not ‘IT ready’. I know some BMS systems support integration using XML and SOAP but that is not based on a generic ‘open standard framework’ for datacenter facilities.

So what does this API need to be ?

First it needs to be an ‘open standard’ framework; publicly available and no rights restrictions for the usage of the API framework.

This will avoid vendor lock-in. History has shown us, especially in the area of SCADA and BMS systems, that our vendors come up with many great new proprietary technologies. While I understand that the development of new technology takes time and a great deal of money, locking me in to your specific system is not acceptable anymore.

A vendor proprietary system in the co-lo and wholesale facility will lead to the lock-in of co-lo customers. This is great for the co-lo datacenter owner, but not for its customer. Datacenter owners, operators and users need to be able to move between facilities and systems.

Every vendor that uses the API framework needs to use the same routines, data structures, object classes. Standardized. And yes, I used the word ‘Standardized’. So it’s a framework we all need to agree up on.

These two sentences are the big difference between what is already available and what we actually need. It should not matter if you place your IT systems in your own datacenter or with co-lo provider X, Y, Z. The API will provide the same information structure and layout anywhere…

(While it would be good to have the BMS market disrupted by open source development, having an open standard does not mean all the surrounding software needs to be open source. Open standard does not equal open source and vice versa.)

It needs to be IT ready. An IT application developer needs to be able to talk to the API just like he would to any other IT application API; so no strange facility protocols. Talk IP. Talk SOAP or better: REST. Talk something that is easy to understand and implement for the modern day application developer.

All this openness and ease of use may be scary for vendors and even end users because many SCADA and BMS systems are famous for relying on ‘security through obscurity’. All the facility specific protocols are notoriously hard to understand and program against. So if you don’t want to lose this false sense of security as a vendor; give us a ‘read only’ API. I would be very happy with only this first step…

So what information should this API be able to feed ?

Most information would be nice to have in near real time :

  • Temperature at rack level
  • Temperature outside of the building
  • kWh, but other energy related would be nice at rack level
  • warnings / alarms at rack and facility level
  • kWh price (can be pulled from the energy market, but that doesn’t include the full datacenter kWh price (like a PUE markup))

(all if and where applicable and available)

The information owner would need features like access control for rack level information exchange and be able to tweak the real time features; we don’t want to create unmanageable information streams; in security, volume and amount.

So what do you think the API should look like? What information exchange should it provide? And more importantly; who should lead the effort to create the framework? Or… do you believe the Physical Datacenter API framework is already here?

More:

Good API design by Google : http://www.youtube.com/watch?v=heh4OeB9A-c&feature=gv

Share

Datacenter & SCADA security

Vorig jaar publiceerde het Platform voor Informatie Beveiliging (PvIB) het artikel over SCADA security van mijn en Jeroen.

Hier is een copy van het complete artikel.

Vorige week bereikte mij het nieuws dat deze genomineerd was voor artikel van het jaar 2012:

Altijd leuk om zulke waardering te krijgen, maar het deed mij beseffen dat er nog veel mythes zijn rond de (on)veiligheid van SCADA systemen en BMS systemen binnen datacentra.

In de komende periode zal ik hier wat aandacht aan schenken op mijn blog.

Share

Labels, metrieken en hokjes voor ‘groene ICT’

Oke, laten we eerlijk zijn… de meeste mensen zijn gek op labels plakken en dingen in hokjes stoppen. Het houd de zaken overzichtelijk en zorgt er voor dat we dingen met elkaar kunnen vergelijken. Zo ook in de ICT sector en de datacenter industrie.

In de afgelopen maanden werd ik diverse keren geconfronteerd met ‘misbruik’ van metrieken <pue blog> of de creatie van nieuwe metrieken of labels. Soms oneigenlijk gebruik van bestaande methode, maar steeds vaker een poging tot introductie van nieuwe labels die vooral gefocust zijn op ‘groen’ en de gehele IT dienstverlening keten.

Binnen DatacenterPulse (DCP) hebben we de diverse lagen en onderdelen in het datacenter gevat in een praat plaat genaamd de DataCenterPulse Stack. Naast het feit dat deze de opbouw en onderlinge afhankelijkheden laat zien van de lagen, word hier ook gesproken over metrieken of labels.

Het gedeelte van “Input metrics –> Layer metrics per business sector” doelt daar op. Het verwijst naar de verschillende metrieken en labels die op de diverse lagen beschikbaar zijn.

Voorbeelden hier van zijn:

  • PUE, op de Physical&Real Estate laag, welke energie efficiëntie in het facilitaire deel van het datacenter in beeld brengt.
  • WUE, op de Real Estate laag, welke efficiënt water gebruik in beeld brengt.
  • SPECpower, op de Platform laag, welke energie efficiëntie voor servers in beeld brengt.
  • Etc…

Diverse organisaties proberen ook al enige tijd een ‘usefull work’ metriek uit te brengen. Deze moet de overhead in energie gebruik laten zien v.s. de hoeveelheid energie die verbruikt word voor het ‘werk dat er echt toe doet’.

Dit is echter lastig op te lossen aangezien ‘usefull work’ voor het ene bedrijf iets totaal anders kan betekenen dan voor het andere bedrijf. De output van IT kan niet altijd op dezelfde manier gewogen worden.

Het brengt ook het probleem met zich mee van het vangen de de alle lagen in de Stack in 1 label of berekening/metriek. Gezien de complexiteit van al deze lagen en de variabelen (kwalitatief / kwantitatief) is de vraag of dat wel haalbaar is.

Een recente discussie die ik mocht bijwonen ging over een ‘groen label voor cloud computing’. Hier mee zou dan gemakkelijk leveranciers te vergelijken zijn en kunnen bedrijven aantonen dat ze ‘groener’ worden door over te stappen naar cloud computing. Het zou dan een F tot A++ label zijn, zoals met wasmachines en koelkasten op dit moment werkt.

Ik begrijp de hang hier naar best, maar laten we deze wens eens uit elkaar trekken:

  1. We beginnen met de definitie: wat is groen dan ? Vaak zie je dat er eigenlijk energie efficiënt word bedoeld. Echter bij groen moet men alle elementen van verbruik mee nemen. Hier in zit dus ook water gebruik en andere grondstoffen. Ook uitstoot moet eigenlijk mee genomen worden. Van totale CO2 uitstoot tot afval van server systemen.
  2. Hoe weet ik of ik ‘groener’ word ? Dit betekend dat ik in de hele context van de vraag moet weten waar ik nu sta en dat ik dit moet kunnen vergelijken met het ICT ecosysteem van een ander.
  3. Wat is dan de definitie van cloud computing ? Hier zijn al hele boeken en blogs over vol geschreven. Deze afkadering is nog steeds erg flexibel. Laten we voor dit argument eens zeggen dat het Software As A Service is (SAAS). Dan betekend dit dat we de hele DCP Stack in 1 label proberen samen te vatten op het onderwerp ‘groen’. Hier in zouden we dus alle soorten koeling, stroom distributie, server typen, besturingssystemen, applicatie frameworks en talen moeten wegen en in 1 label moeten vangen…

Een label op deze twee grote hypes (groen & cloud) die uit zulke complexe onderdelen bestaat… schreeuwt om misbruik door zijn eigen industrie. Zoals we binnen de datacenter industrie ook met PUE hebben gedaan.

Dit brengt ons bij het punt van creatie, acceptatie en standaardisatie van metrieken en labels. Mijn GreenGrid collega Andre Rouyer gebruikt daar altijd een mooi plaatje voor:

image

Deze begint bij Industry Alliances zoals de Green Grid, ICT~Office, DatacenterPulse, etc.. Dit is vaak de broedplaats voor nieuwe labels en metrieken. Zodra is voldoende markt acceptatie is, worden deze uitgewerkt door Standaardisatie organisaties. Denk hierbij aan NEN, CENELEC en ISO. Deze uitwerking leid tot een meetbaar en auditbare norm op het label of de metriek. Het zorgt voor duidelijke definities en beoordelingscriteria. Hierna worden deze normen opgenomen in (lokale) regelgeving door de diverse Overheden en kan er op gehandhaafd worden. Dit totale proces duur jaren.

Met de PUE hebben we gezien hoe dit proces kan (mis)lopen: bedacht door de GreenGrid en uitgewerkt in 2 a 3 jaar. Op dit moment ligt het op ISO niveau waar het tot een internationale standaard uitgewerkt gaat worden in de komende 2 a 3 jaar. In de tussen tijd heeft echter de overheid de PUE al opgepikt om er op te handhaven. Daarbij is er dus een belangrijke stap overgeslagen.

Het gebruik van metrieken&labels voor regulering vanuit overheid moet daar naast ook niet leiden tot de blokkade van innovatie zoals dat bij de adoptie van ASHRAE 90.1 gebeurde, waarbij het uitgebrachte label elke andere vorm van innovatieve koeling uitsloot. Als dit label vervolgens een wettelijke eis word door overheid adoptie, dan streeft deze in feiten zijn eigen doel voorbij.  

Men moet dus goed nadenken over de consequenties van de introductie van metrieken en labels:

  1. Is het wel haalbaar; probeer ik niet een te complex systeem te vangen ?
  2. Zijn de definities van de onderdelen die ik probeer te vangen wel helder ?
  3. Welke manipulatie laat het label toe ? (gaming the system)
  4. Indien er adoptie plaats vind door de overheid; welke effecten zal dit hebben op je sector/industrie ?

Het proces daarna is zo mogelijk nog belangrijker: uitproberen en testen van het label/metriek door de markt –> veel feedback verzamelen en verwerken –> aanscherpen en verder uitwerken. Indien blijkt dat het toch niet zo’n goed idee was, dan ook niet bang zijn om weer afscheid te nemen van het idee. Pas als het label goed gerijpt en uitwerkt is, dan is het klaar voor de stap naar standaardisatie.

De roep om een label is makkelijk gedaan, maar zoals de Amerikanen zeggen ‘Be Careful What You Wish For’.

Share

Nabrander – Groene software; door beïnvloeden van gedrag

Naar aanleiding van de workshop rond groene software, mijn blog en presentatie daar, zijn er nog een aantal zaken die ontbraken in mijn vorige blog of interessante zaken die voorbij kwamen in de discussie.

sf

1. Virtualisatie.

Zoals de heren van Schuberg Philis lieten zien in hun presentatie, zijn veel systeem resources op servers onderbenut. Virtualisatie kan daarbij duidelijk een rol spelen; het zorgt voor betere uitnutting van de beschikbare hardware. Aangezien een server die niets staat te doen (idle is) toch 40-60% van zijn maximale energie consumeert, levert dit dus energie besparingen op.

2. Strippen en tunen van je server OS.

In de discussie kwam de overhead van besturingssystemen aanbod; In de afgelopen jaren zijn besturingssystemen (OS’en) zoals Windows en Linux uitgegroeid tot alleskunners. De leverancier van het OS weet uiteraard vooraf niet wat de klant er op wil draaien. De ene keer kan het een email servers zijn, de volgende keer een database server. Standaard komt een modern OS dus met een waslijst aan services of daemon’s die aan staan. Daar boven op komen vaak nieuwe services van een virusscanner, een inventory tool, monitoring tool, etc.. Al met al gaan er een hoop computer resources verloren met al deze services en deamon’s.

IT Security specialisten leren ons echter ook al jaren dat je server OS’en dient te ontdoen van al deze overhead. Dit maakt namelijk de mogelijke ingangen voor hackers kleiner. Diverse tools van IT leveranciers kunnen hierbij helpen. Ook kan men steeds meer kiezen voor zo geheten virtual appliances. Deze virtuele servers zijn door de leverancier al gestript en taak specifiek gemaakt.

Het strippen en tunen van je server OS na het installeren van zijn specifieke rol is dus een security en (energie) efficiëntie noodzaak.

kngs-sf3. Is energie afname van software wel te ‘zien’ ?

Er was een kritische kanttekening bij het feit of de energie afname van een query wel te zien was;

Systeembeheerders weten al enige tijd dat het systeem wat zijn in beheer gaan nemen voorzien moet worden van een baseline. Hierbij word basis gedrag van het systeem bepaald, zodat er binnen monitoring en beheer applicaties drempelwaarde gezet kunnen worden om het nieuwe systeem in de gaten te houden. Op deze manier worden de beheerders niet onnodig belast met valse meldingen.

Tijdens een goed OTAP proces met performance testen, worden dit soort baselines opgesteld voor hele applicatie ketens. Dit helpt de test&performance analist om te bepalen hoe de applicatie keten werkt en of deze goed werkt. Deze gegevens kunnen later gebruikt worden om de beheerder te voeden voor zijn baseline.

Als men een goede baseline (op een gestripte server) vast stelt, is het zeer goed mogelijk voor een applicatie ontwikkelaar om relaties te leggen tussen de handelingen die zijn code uitvoert en het gebruik van systeem resources.

4. Server energie afname.

Zoals bij 1 aangegeven gaat ook een hoop energie verloren in systemen die niets staan te doen. Tijdens de discussie gaf dit een opening tot de ontwikkeling van efficiënte hardware. Daar heb ik in vorige blogs al een hoop overgeschreven. Wat nog specifiek het vermelden waard was:

OpenCompute project heeft een OpenRack design uitgebracht waarbij o.a. met DC power gewerkt word in het rack. Servers hier voor zullen binnen kort van HP en Dell op de markt komen. Binnen kort meer…

De Schuberg Philis mannen tipte mij nog een Anandtech artikel over een test met OpenCompute server hardware; http://www.anandtech.com/show/4958/facebooks-open-compute-server-tested

5. IT Energie afname is geen focus voor vele.

Al vroeg tijdens de bijeenkomst viel het feit dat energie afname door IT, voor veel bedrijven geen primaire focus zou zijn. Dat is een punt wat ik onderschrijf, zeker voor bedrijven waarbij ICT niet hun primaire product is maar een ondersteuning. Voor veel van dit soort bedrijven zitten hun grote kosten (OPEX) niet in energie.

In 2009-2010 concludeerde diverse mensen en organisaties al dat de adoptie van energie efficiëntie daar door maar lastig op gang komt. Zolang er voor een bedrijf geen grote financiële motivator onder zit, zal het lastig blijven om hier focus op te krijgen.

De opkomst van Cloud computing en met name bedrijven in de IAAS / PAAS sfeer, helpt om holistisch gezien deze efficiëntie slag wel te maken;

Voor de bedrijven die de IAAS/PAAS dienst leveren is het datacenter en zijn energie afname wel een grote kosten post, zeker gezien de schaal grote waar veel van dit soort infrastructuren op worden gebouwd. Het verhuizen en consolideren van IT services uit de bezemkast van niet-IT-bedrijven naar een Cloud computing provider levert op dit vlak dus een juiste prikkel.

Zoals in mijn vorige blog vermeld, krijgen de gebruikers van de IAAS/PAAS diensten ook een goede prikkel om efficiëntie programmeer code te gebruiken. De pay-per-use modellen in veel Cloud computing aanbiedingen zorgen daar voor;

“the art of efficiënt programming is lost… Cloud will bring it back… “

Share

Groene software; door beïnvloeden van gedrag

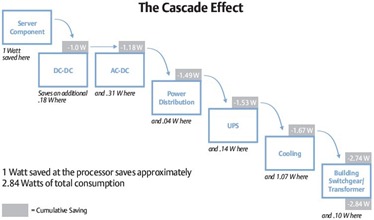
the_cascade_effectKijkend naar energie verbruik zien we dat elke Watt die bespaard word bij de bron uiteindelijk optelt tot een veelvoud daar van in de gehele energie keten van het datacenter. Emerson noemt dat het Cascade Effect.

Nu we zien dat de PUE langzaam richting de (theoretische) 1 zakt, word het zaak om te kijken welke winsten er nog meer te behalen zijn in het datacenter. Op facilitair vlak gaat daar bij de focus naar bijvoorbeeld WUE. Op het vlak van IT was men al bezig efficiënter om te gaan met de bronnen door de inzet van bijvoorbeeld virtualisatie en deduplicatie. 

Dit alles speelt zich echter af op de IT infrastructuur laag. Wat zou er dus nog te behalen zijn bij de ‘echte’ bron in de ICT; software & applicatie ? Door hier te bezuinigen zouden we volgens het cascade effect een veelvoud moeten kunnen besparen.

Begin 2010 haalde ik al aan dat er diverse leveranciers, waar onder Microsoft, Intel en HP, bezig waren de mogelijkheden te verkennen door applicatie ontwikkelaars inzicht te geven in energie verbruik van hun systemen. Dit door middel van SDK’s.

In de afgelopen jaren, waar in ik verantwoordelijk was voor diverse omgevingen binnen commerciële en overheidsbedrijven, heb ik de kans gehad om te kunnen experimenteren met de gedachtes rond beïnvloeden van IT gebruik, door met name ICT-ers zelf. Dit door middel van transparantie in gebruik en verbruik van ICT en het ontwikkelen van kostenmodellen hier op.

Het recent opgerichte Knowledge Network Green Software is ook bezig met dit soort ontwikkeling. In aanloop naar een bijeenkomst hier over op 8 mei 2012 aanstaande, vast een samenvatting van mijn ervaringen rond de ontwikkeling van groene software door het beïnvloeden van verbruiksgedrag. 

Gedachte

Door ontwikkelaars inzicht te geven in verbruik, kun je zorgen dat ze efficiënt omspringen met hun resources. Dit is een normale manier van benaderen als het gaat om IT resources zoals CPU, RAM en verbruik van Disk I/O’s. De software ontwikkelaar controleert de performance van het systeem (eventueel met een software tester) zodat zijn eind product op een normale manier functioneert.

De opkomst van kosten modellen is ook een trend in ICT. Zeker de introductie van virtualisatie heeft dit bevorderd. Aan de ene kant was er de wens vanuit de business om meer naar een pay-per-use model te gaan en andere andere kant was er soms de wens vanuit de IT afdeling om virtualisatie aan banden te leggen. De zo genaamde VM Sprawl is een bekende term voor ICT-ers, waarbij het gemak en de lage kosten voor een virtuele server (VM) leiden tot honderden virtuele servers waar niemand meer van wat van wie ze zijn en waarom ze er zijn. Om dit gedrag aan banden te leggen werden de kosten van VM’s in beeld gebracht en (automatisch) door belast.

Wat nu als we het performance inzicht voor de ontwikkelaar uitbreiden met inzicht in stroom verbruik en deze voorzien van een kosten prikkel door kWh te verrekenen?

Hier mee zou hetzelfde gedrag gestimuleerd kunnen worden als die bij de introductie van slimme energie meters in de thuis omgeving; gedrag sturen door inzicht te geven. Het werkt voor de Eneco Toon en de Nuon E-manager

OTAPdtap

De experimenten werden uitgevoerd in een zo geheten OTAP omgeving (of DTAP in het Engels). Dit is een belangrijke basis aangezien een dergelijke omgeving zorgt voor gecontroleerde uitrol van software en een consistente omgeving. Dit betekend dat de omgeving waar in ontwikkeld, getest en geaccepteerd wordt gelijk is aan de productie omgeving.

In de OTA omgeving word de software ontwikkelaar of database query schrijver voorzien van enkele standaard metrieke voor zijn software ontwikkelaar; CPU , RAM en disk I/O gebruik.

dashboard

Deze werd aangevuld met kWh gegevens van de gebruikte systemen. Al deze gegevens waren (near-)realtime beschikbaar. Zo was het effect van wijzigen van enkele regels code of een query op een database direct terug te zien.

Om de juiste prikkel te creëren werden alle projecten die de OTA omgeving gebruikte belast voor het gebruik van hun resources. Dit op basis van een vast component rond afschrijving van de gebruikte hardware en het beheer daar van. Het flexibele component was het kWh verbruik. Het loont dus voor de project leider om systemen s ’nachts uit te laten schakelen en projectleden te stimuleren energie efficiënte code te schrijven.

Na de normale OTA procedure word de software in productie genomen. Tijdens de experimenten word in productie nogmaals gemeten. Dit om te controleren of aangepaste versies van de software (releases) werkelijk efficiënter zijn geworden in de productie situatie.


Technische setup

Om dit alles technisch te kunnen laten werken is wel een omgeving nodig waar in de feedback bijna realtime aan de ontwikkelaar gegeven kan worden.

Tijdens de diverse experimenten werd daar voor het volgende gebruikt:

  • HP c-class blades, IPMI, OA, ILO – De HP ILO en OA (voor blades) geeft realtime inzicht in energie verbruik. Deze gegevens zijn o.a. via scripts (SSH) op te vragen. Voor andere systemen kan men terug vallen op IPMI. Veel IPMI implementaties geven de mogelijkheid om energie verbruik te zien. Er zijn diverse (opensource) tools beschikbaar om IPMI gegevens op te vragen en te verwerken.
  • Windows, Linux – Als besturingssysteem (OS). Deze OS’en kunnen optioneel gebruik maken van Microsoft’s Joulemeter of Intel’s Energy Checker SDK.
  • Oracle DB , Java –
    Als database en default programmeer taal.
  • HP OpenView, HP Insight Control – Voor collectie, verwerking en dashboarding van de gegevens. Uiteraard kan hier voor ook opensource producten zoals Cacti gebruikt worden.
  • VMware vCenter – Voor inzicht in virtuele systemen.
  • Visual Studio performance testing, HP LoadRunner (Mercury) – Deze ontwikkel tools bieden ook veel mogelijkheden om realtime gegevens rond performance en gebruik uit systemen te halen.

Aandachtspunten uit deze experimenten

Bovenstaande setups werkte uitstekend. Zonder veel moeite kon in de meeste gevallen 20% op de energie worden bespaard. Dit door de juiste query’s en code te schrijven. Ook werden de software ontwikkelaars scherper op het schrijven van code zonder al te veel overhead.

De experimenten kende ook de nodige (onopgeloste) uitdagingen:

– Virtualisatie; het meten van energie consumptie met IPMI op hardware niveau is goed te doen. Echter op VM niveau word het een stuk lastiger. VMware heeft al wat werk op dit vlak gedaan met hun Host Power Management in vSphere 5. Zie: http://www.vmware.com/files/pdf/hpm-perf-vsphere5.pdf. Dit is een goede eerste stap, maar verdient nog nadere uitwerking. Af en toe week het totaal energie verbruik op hardware niveau af van het totaal verbruik van de VM’s of werden er cijfers gerapporteerd die niet realistisch aan voelde. Microsoft is ook aardig op weg met hun Joulemeter. De whitepapers van dit Microsoft team zijn echt een must-read voor energie verbruik&virtualisatie. Het is echter onbekend wat de integratie is met Hyper-V. Energie meting opties met KVM of Xen zijn niet gevonden ten tijden van de testen.

– Slechte interne sensoren; in navolging van de afwijkende getallen in de virtualisatie omgeving rond energie verbruik zijn er controles gedaan met externe, geijkte, energie meters. Hierbij bleek er soms 40% verschil te zitten tussen de door HP OA/ILO gerapporteerde energie afname op hardware niveau en de externe meter. Al met al werd geconcludeerd dat in sommige hardware implementaties kwalitatief slechte sensoren gebruikt worden.

– OTAP gedachte; bovenstaande experimenten werken alleen als alle stappen uit het OTAP proces voorzien zijn van dezelfde of nagenoeg zelfde omgevingen. Dit betekend dat men niet alleen software op  release matige manier moet uitrollen, maar ook zo met infrastructuur moet omgaan. Hierbij waren tijdens de testen bijvoorbeeld verschillen te zien in energie efficiënte query’s die wel goed werkte in OTA maar in productie niet. Daarbij bleek productie in 1 geval voorzien te zijn van een Oracle database patch die niet in OTA aanwezig was. Deze had een 60% stijging in energie tot gevolg. In een ander geval waren het enkele ontbrekende Microsoft Windows patches.

– Keten denken & architectuur; al snel bleek dat energie verbruik en efficiëntie ook mee genomen moet worden in de totale architectuur van een applicatie en zijn infrastructuur. Juist bij de applicaties die meerdere systemen gebruiken om hun functionaliteit te kunnen leveren, zijn grote besparingen te halen. Een 3 lagen architectuur is daarbij niet vreemd tegenwoordig; database – applicatie – webserver. De focus tijdens de ontwikkeling dient dus breder te zijn dan enkel die ene query op de database. Hierbij kunnen integratie en test specialisten op infrastructuur en software niveau een rol spelen.

– Keuze van hardware, software; de testen en experimenten zijn uitgevoerd met componenten die op dit moment vast lagen in de architectuur en standaarden. Er is niet gekeken welke effecten de selectie van hardware, besturingssysteem, middelware, database, programmeertaal of programma framework heeft op de energie afname. Wel kwam de keuze voor hardware tot stand door SPECpower als selectie onderdeel te gebruiken.

– Open en integratie; integratie tussen de diverse IT lagen was de sleutel om dit geheel inzichtelijk te krijgen. De schakel die echter miste was de integratie met het fysieke datacenter. Zo levert de PDU en andere elementen uit de energie keten ook kWh gegevens. Deze waren lastig te integreren, zeker als het gaat om protocollen als Modbus.

Integratie en keten denken

Dit laatste punt word ook in de DatacenterPulse Top10 (PDF) voor 2012 aangehaald:

10. CONVERGED INFR. INTELLIGENCE • UPDATE: The Data Center Infrastructure is becoming a complex machine requiring connection up the stack • Treat the DC infrastructure as an IT system • Converge in the infrastructure instrumentation and control systems • Connect it into the IT systems for ultimate control• Standardize connections and protocols to connect components • What’s measured and controlled will be addressed and tuned

Daarbij is de laatste de ‘oneliner’ waar het allemaal om draait: “What’s measured and controlled will be addressed and tuned”

Ondanks bovenstaande uitdagingen zullen we zien dat de komende jaren er steeds efficiëntere software zal ontstaan. Dit zal misschien niet direct gedreven worden vanuit de enkele centen die bespaard worden op de kWh maar meer vanuit het pay-per-use kosten model waar Cloud computing ons mee confronteert. De uitrol van inefficiënte software code of frameworks zal direct een hogere rekening van Amazon (AWS) opleveren. En niets werkt zo stimulerend als dat…

Share